Accessing the Dashboard
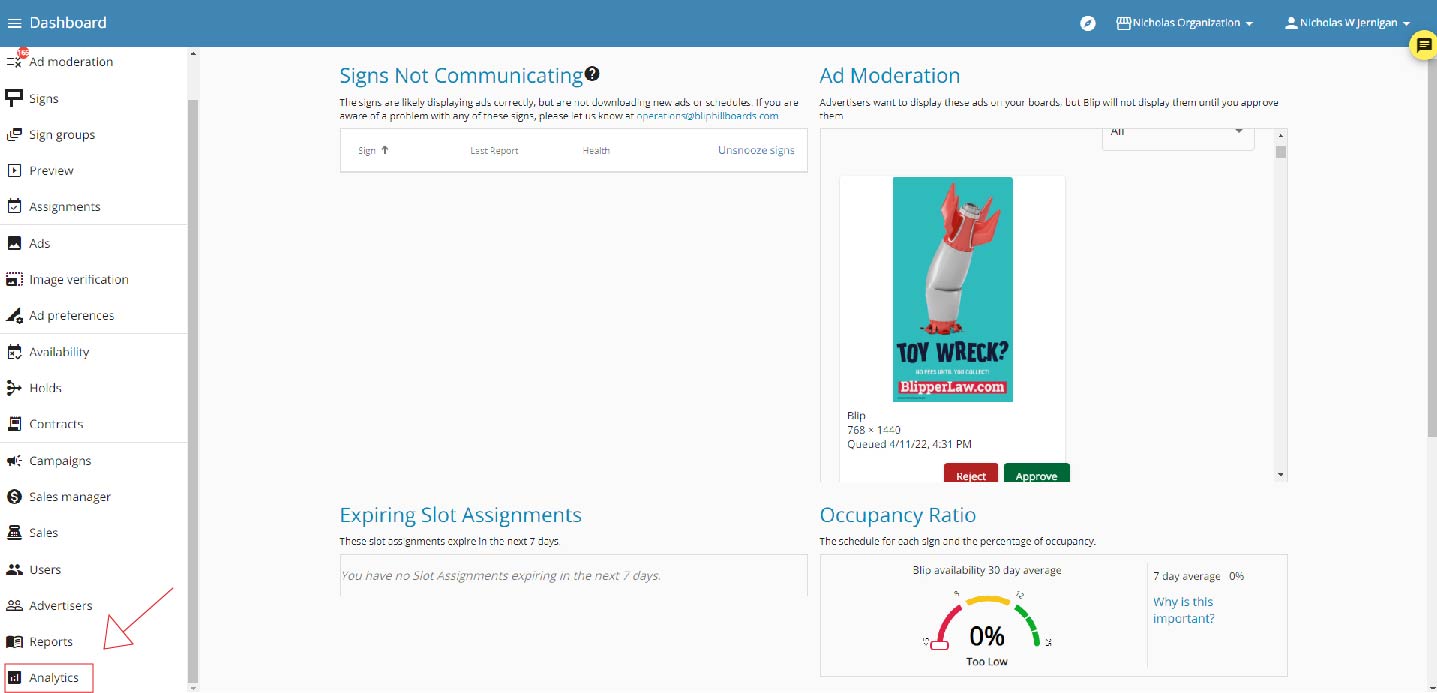
After you log into operator.blipbillboards.com you can choose the 'Analytics' tab on the left hand side. This will take you to the dashboard. Note that the button might be higher on the page than in the below picture, but it will be on the left hand side.
Guide to the Dashboard
Summary Portion:
The first part of the dashboard is the summary portion. 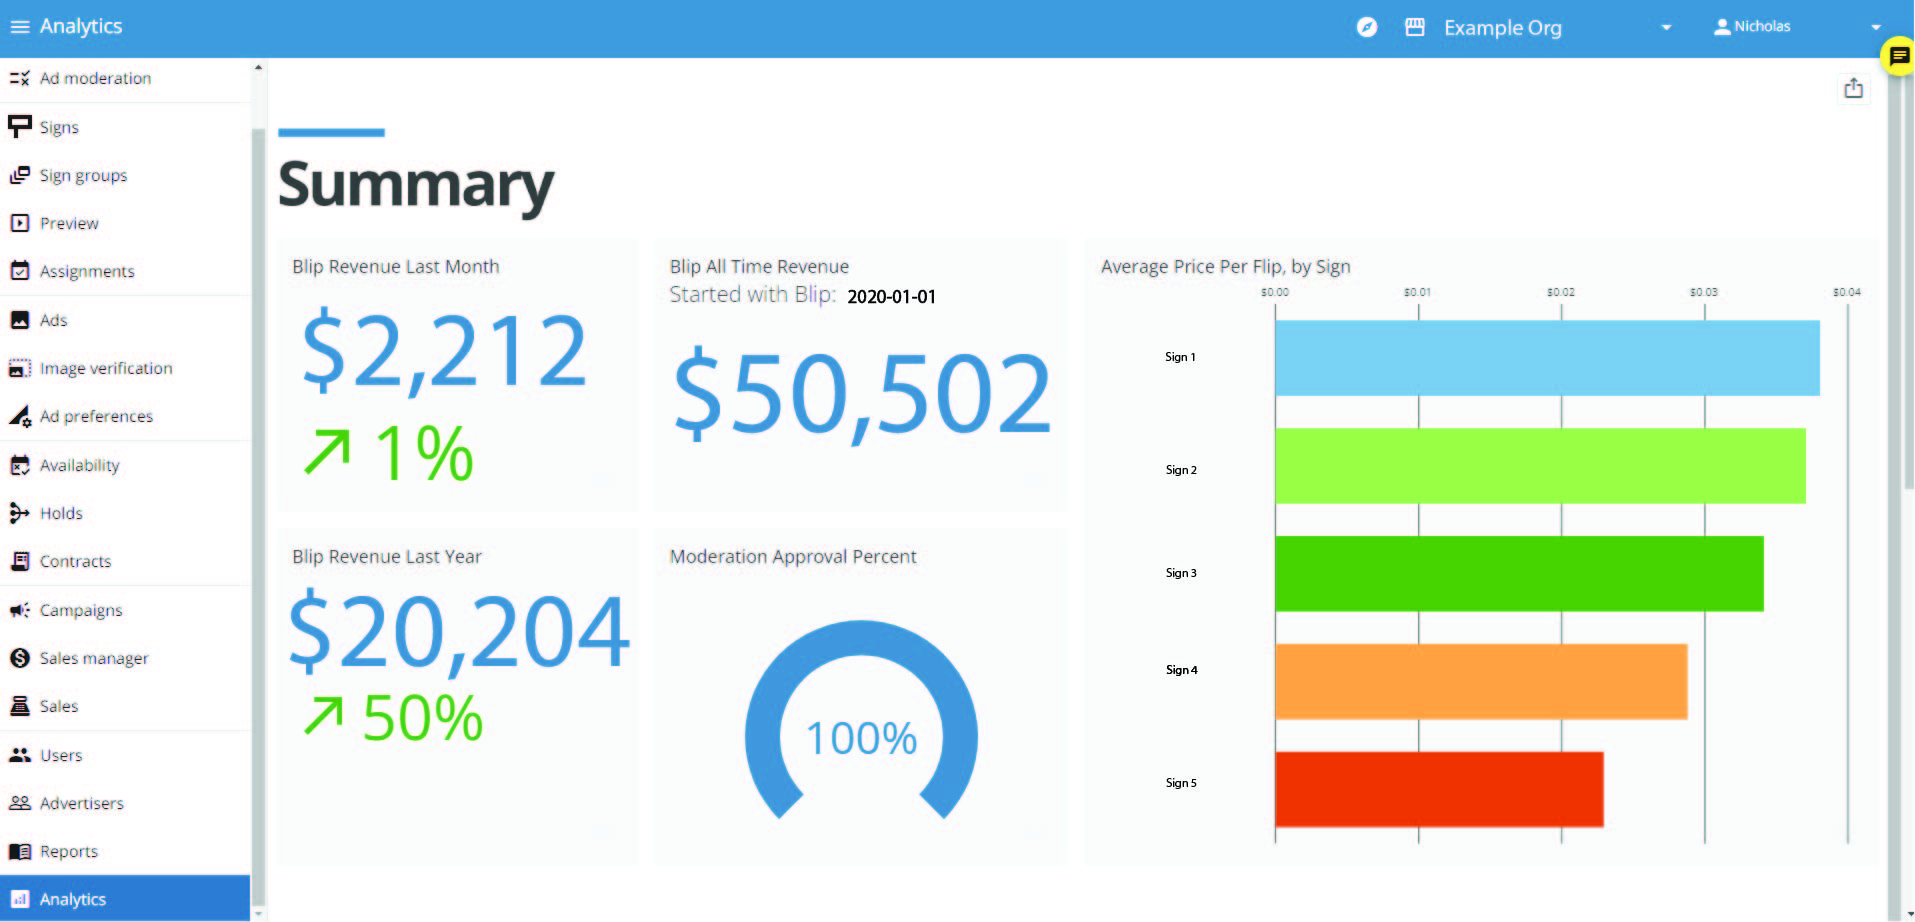
Blip Revenue Last Month - This displays the total amount of Blip revenue collected last month. This is the same amount you will be paid during the week of the 15th this month. The colored number and arrow underneath show how last months revenue compares to the month before. If you made $1000 two months ago, and $1010 this month, then the number would be a green 1% to represent the 1% increase in revenue.
Blip All Time Revenue - This displays the total Blip revenue collected for all time. Note that this does not include programmatic revenue.
Blip Revenue Last Year - This displays the total Blip revenue collected last year. The colored number and arrow underneath show how last year's revenue compares to the year before. If you made $10,000 two years ago, and made $11,000 last year, then the number would be a green 10% to represent the 10% increase in revenue.
Average Price Per Flip, by Sign - This bar chart shows the average price per flip by sign for all flips that happened this quarter. This includes the average of all flips, both Blip and Programmatic.
Detail Portion:
The rest of the dashboard contains details about revenue that are filtered by a calendar.
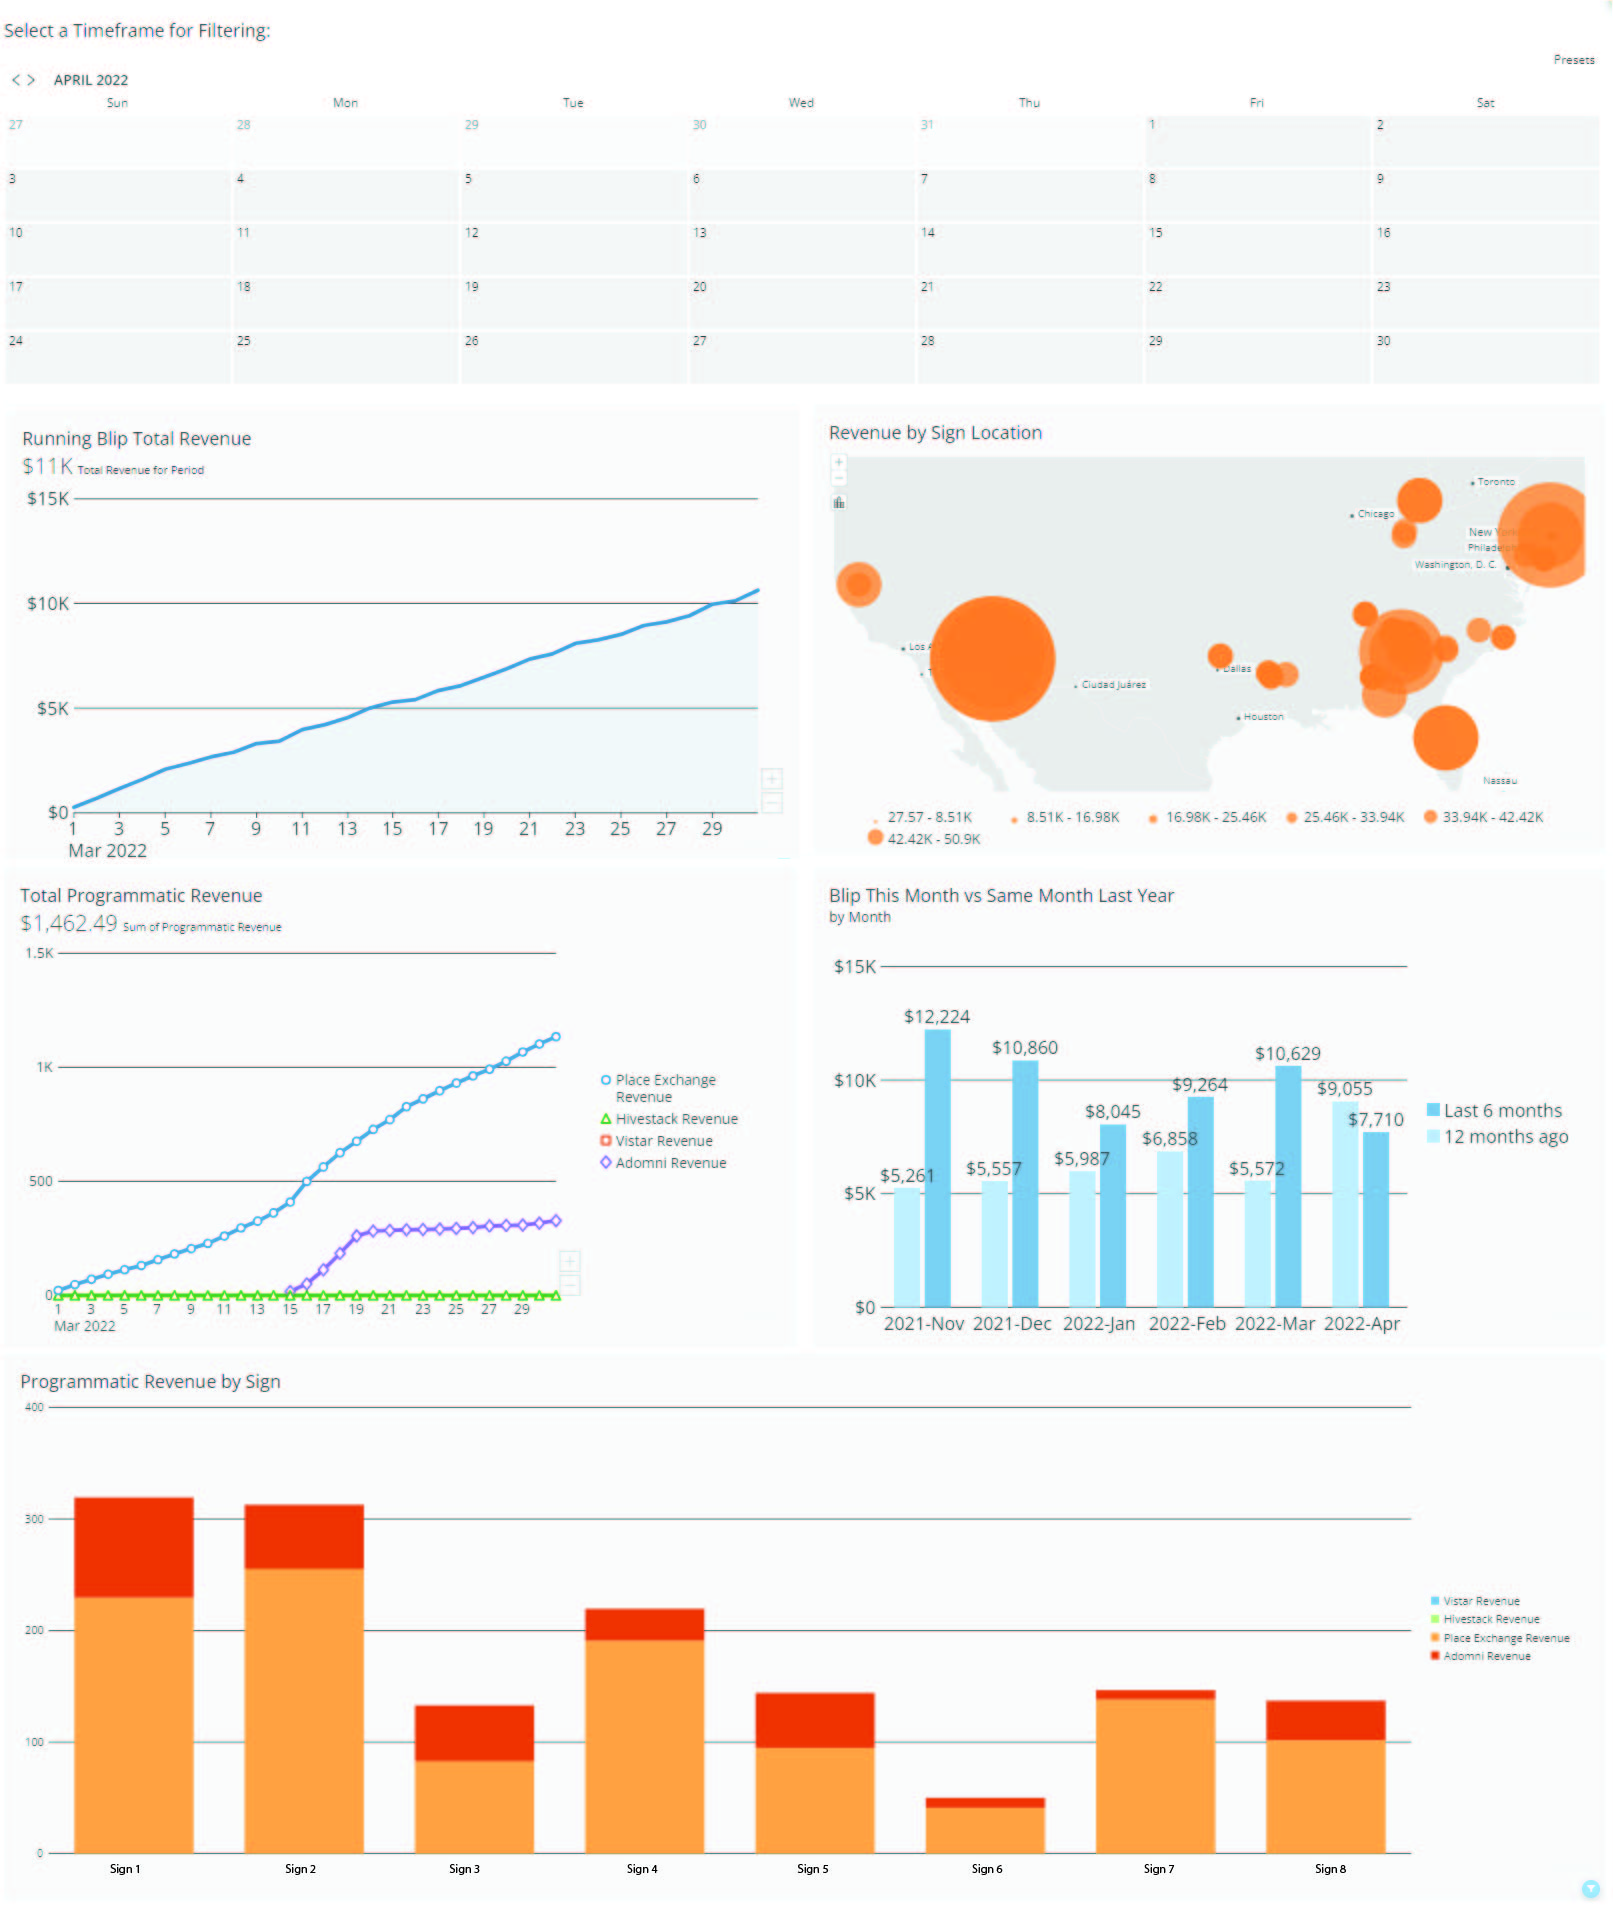
Time Filter - There is a calendar where you can select the time frame that will filter most charts in this section. To use this calendar, navigate to the month you want to select a date in using the arrows at the top left of the calendar. Then click on the start date you would like. The calendar will then take you back to the current month. You can then navigate and select the end date you would like. At any time if you would like to undo the filter you can made you can click on the filter button with a slash through it in the top right corner.
Running Blip Total Revenue - This displays the total Blip revenue collected during the selected time frame.
Revenue by Sign Location - This displays the total price of flips by location as filtered by the calendar. This includes all revenue sources total price before revenue splits.
Total Programmatic Revenue - This displays the total programmatic revenue generated in the time frame chosen by the calendar. This, along with the Programmatic Revenue by Sign, summarizes all programmatic revenue.
Programmatic Revenue by Sign - This displays the total programmatic revenue split up by sign in the time frame chosen by the calendar. You can use this chart to see and download programmatic revenue you can expect to receive from each programmatic partner for the selected time frame.
Blip This Month vs Same Month Last Year - This displays the total Blip revenue the past six months. If you had revenue a year ago during those same months, the chart will also display how much Blip revenue was made those same months last year.
Extra Tips:
Predicting Revenue (Plus and Minus buttons): Some of the graphics have a plus and minus button at the bottom right corner of the chart. You can click the plus button to see a prediction of what the revenue will be during the next time period for the chart. The minus button will remove the next prediction.
Downloading Reports: Each graphic has a download button at the top right corner. When you download a report it will contain all the data used to make the graphic. Some of the graphic downloads are particularly useful:
- Programmatic Revenue by Sign, when you download this graphic after selecting a chosen time frame using the calendar, you will get a revenue report for all programmatic revenue generated.
- Running Blip Total Revenue, when you download this graphic you can see how much revenue was generated each day by your Blip enabled signs.
Available on Mobile: You can see this same dashboard on your phone! This dashboard has been optimized for mobile.
As always, if you have questions reach out to us at operations@blipbillboards.com.