Congratulations! Your campaign is now running! Now, you can review the performance of your campaigns by viewing your analytics. Some notes:
- Analytics are not always real-time data, and can sometimes take a day to update.
- For real-time information, please use Reports
- Analytics are 'all time' data, meaning the numbers shown represent how your campaign has performed since it began
- If you would like to see data within a specific date range, you can run a proof of performance report
On the front of your campaign card you will find some basic information such as:
-
Total Spend, how much your campaign has spent so far
-
Total Blips, how many times your ad has displayed so far
-
Total Blips this week, how many times your ad has displayed this week so far
-
Total Blips yesterday, how many times your ad displayed yesterday
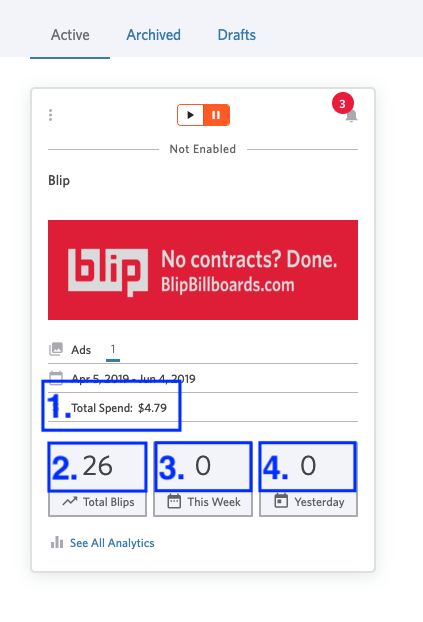
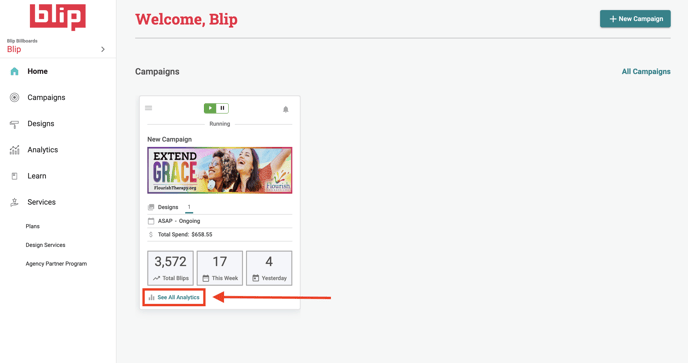
Click "See All Analytics" for more detailed information
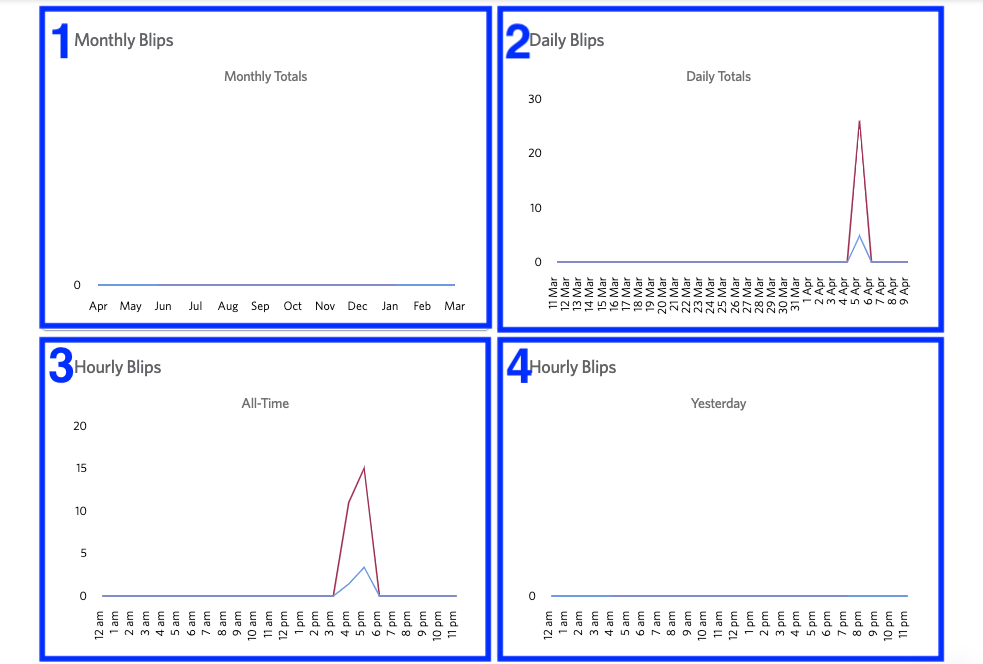
The first four graphs show the Blips you have received at different times. Here is a breakdown of the information you receive on each graph:
-
The Monthly Blip Totals, see the Total Blips you have received each month over the past year.
-
The Daily Blip Totals, see how many Blips you have received each day. This graph will show each day for the past month
-
Hourly Blip Totals, see the times of day your Blips have displayed since your campaign began.
-
Hourly Blips Yesterday, see the times of day your Blips displayed yesterday.
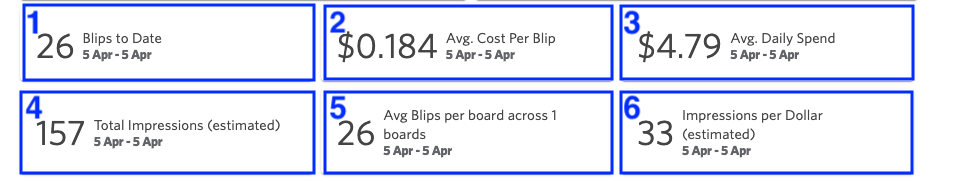
When you scroll down you can find more specific analytics. Here is the breakdown:
-
Blips to Date, see how many Blips you have received since your campaign began (the date ranges of your campaign are also listed below)
-
Average Cost Per Blip, see how much it costs on average each time your ad displays for 8 seconds on a billboard
-
Average Daily Spend, see how much you spend on average each day
-
Total Impressions, see an estimated number of people who have seen your ad since your campaign began (we receive this information from the sign owners)
-
Average Blips per board, see how many Blips you receive on average on each of the billboards on your campaign.
-
Impressions per dollar, see how many people on average see your ad for each dollar that you spend.
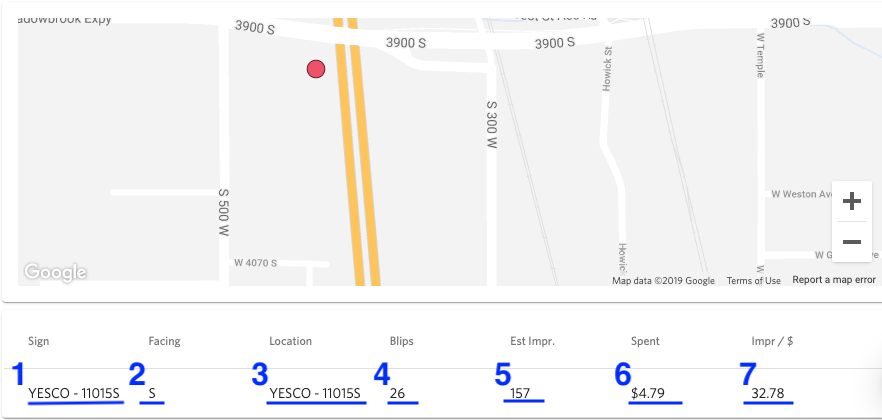
Scroll down further and you can see a breakdown of the performance of your ads per billboard location, this will show details about each sign your campaign has ever displayed on since your campaign began. If you remove a sign from your campaign but continue running the campaign on other locations, the data about the removed signs will still appear on these analytics. Here is the breakdown:
-
The sign name
-
Facing, see which direction the billboard faces
-
Location, see where the billboard is located
-
Blips, see the total Blips received on that board
-
Estimated Impressions, see how many people have seen your ad on that billboard
-
Spent, see how much has been spent advertising on that sign
-
Impressions per dollar, see how many people have seen your ad on that sign for each dollar spent
If you have any questions about this information, please reach out to Blip Support via chat or email.